
How the Nervous System Works and How to Reset It
Measuring Nervous System Health
HRV is the clearest signal of nervous system health. Learn to measure it with wearables or the 35-second voice-based Stress Test in the NuCalm app.
If you want to know whether your nervous system is actually more balanced, not just whether a particular Tuesday felt easier than the one before, you need something you can track over time, and that’s exactly what Heart Rate Variability (HRV) gives you. This is one piece of the larger nervous system regulation picture: the part where a subjective sense of calm gets replaced by an actual, trackable number.
What HRV Actually Measures
HRV doesn’t measure how fast your heart beats, it measures how much the spacing between individual beats varies from one to the next. A heart that beats with perfectly even spacing, tick-tick-tick-tick, actually reflects a nervous system locked into a single gear, unable to make small adjustments in response to breath, movement, environmental factors, or emotional state. A heart with more natural variation in that spacing, speeding slightly, slowing slightly, moment to moment, reflects a nervous system with the ability to maneuver between its two branches: sympathetic (“fight-or-flight”) and the parasympathetic (“rest-and-digest”). In this context, more variability, a higher score, is the healthy sign, and a persistently low score is one of the clearest available signals of chronic sympathetic dominance.Vagal tone is closely linked to HRV because both are shaped by how actively the Vagus nerve is signaling the parasympathetic branch to stay engaged. Strong vagal tone tends to show up as higher HRV; weak vagal tone tends to show up as a flatter, more rigid heartbeat pattern regardless of what’s actually happening around you.
How to Get Your HRV Score
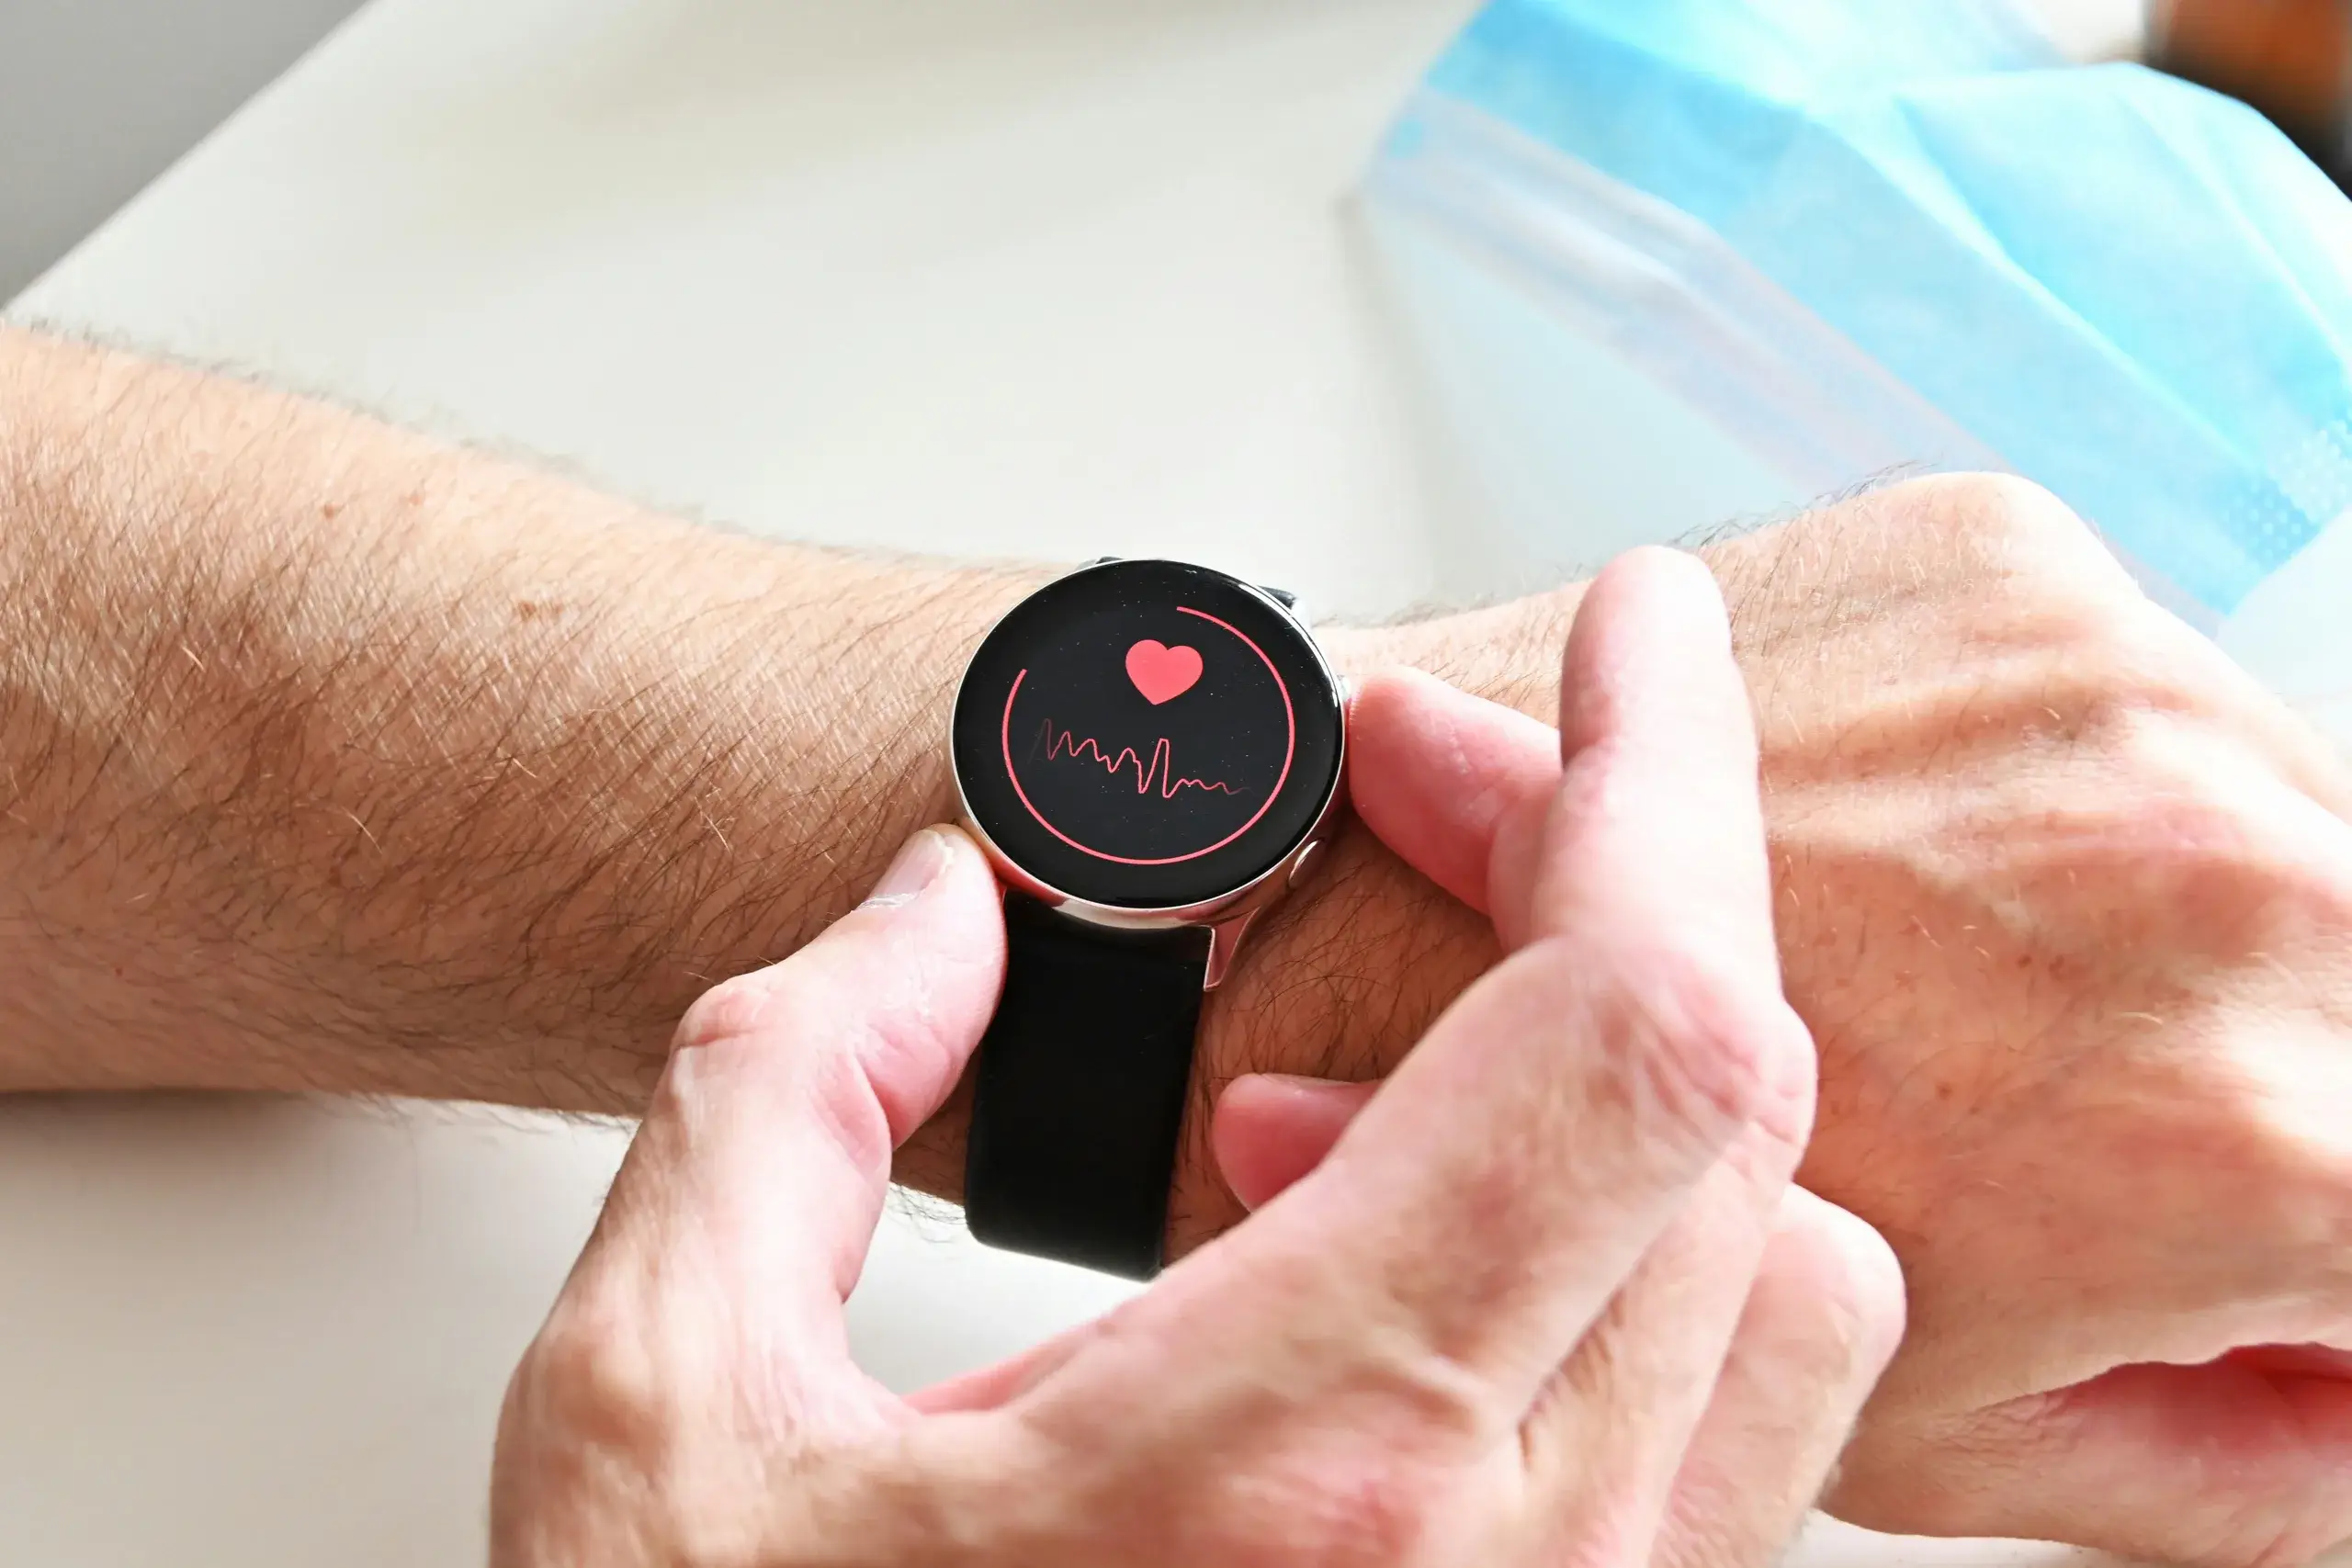
There’s more than one way to arrive at an HRV reading, and they vary in how they collect data, accuracy, and reporting. Chest-strap, wrist-worn, and ring devices have been available for consumer purchase for years, and they’re pretty good at establishing a trend line across weeks and months. Unless you are using medical-grade technology to measure your HRV, the absolute score is not accurate nor is it consistent among varying devices as algorithms and data collection point (closest to the heart is best) differ. It’s best to monitor trends and not absolute scores. Note that HRV is impacted by genetics, age, and gender. Additionally, HRV can reflect a poor score for multiple days after a noteworthy event (poor night of sleep, travel day, alcohol consumption, etc.).
A newer category skips the hardware requirement entirely. The Stress Test in the NuCalm app analyzes roughly 35 seconds of natural speech, drawing on more than 10,000 biometric markers embedded in vocal frequency, and returns a single coherence score reflecting ANS balance in that moment, no strap, no wearable, nothing to charge overnight. It isn’t a replacement for continuous clinical HRV monitoring, but it lowers the barrier to getting a real physiological data point to something you can do standing in your kitchen. Pairing an intake reading before a Rescue session with a second reading afterward is the fastest way to see a shift for yourself directly, rather than waiting on a slow-moving weekly trend line to confirm it.
The Research Behind the Approach
In 2014, a research team at Harvard Medical School used medical-grade HRV monitoring technology to validate and substantiate NuCalm’s ability to reliably and predictably solve stress since it balanced the autonomic nervous system after each recovery session. The methodology was simple in that HRV was monitored before and after a Rescue session. This resulted in NuCalm’s patent (U.S. Patent 9,079,030) being awarded for, “for systems and methods for balancing and maintaining the health of the human autonomic nervous system,” in 2015. It remains the only patent in the world to effectively stop stress in the brain and body rather than simply promote relaxation as a subjective state.
What a Session Actually Moves
The physiological markers the research tracked go beyond a single number. Heart rate itself typically declines, along with the ratio between low-frequency and high-frequency heart rhythm activity, a pattern generally interpreted as reflecting a shift toward greater parasympathetic activity. At the same time, markers like SDNN and RMSSD, two of the standard clinical measures of beat-to-beat variability, tend to move upward. None of these require a clinical background to interpret in practice: they’re all pointing the same direction, toward a nervous system spending more of its time in recovery mode rather than alert mode.
Reading Your Own Trend Line
Your score will move around day to day, because your autonomic nervous system is responding to everything happening in your life, a rough commute, a sick kid, a hard conversation, a genuinely good night’s sleep. A single reading is a snapshot. The number that actually matters isn’t any individual day’s result; it’s whether your baseline, measured across several weeks, is trending upward. That’s the difference between “I had a stressful Tuesday” and “my nervous system is, on the whole, recovering less well than it used to”, and only a trend line can tell you which one you’re looking at.For the fuller context of why measurement matters inside the broader regulation picture, see the complete nervous system regulation guide.
If you want to know whether your nervous system is actually more balanced, not just whether a particular Tuesday felt easier than the one before, you need something you can track over time, and that’s what heart rate variability (HRV) gives you. This is one piece of the larger nervous system regulation picture: the part where a subjective sense of calm gets replaced by an actual, trackable number.
What HRV Actually Measures
HRV doesn’t measure how fast your heart beats, it measures how much the spacing between individual beats varies from one to the next. A heart that beats with perfectly even spacing, tick-tick-tick-tick, actually reflects a nervous system locked into a single gear, unable to make small adjustments in response to breath, movement, environmental factors, or emotional state. A heart with more natural variation in that spacing, speeding slightly, slowing slightly, moment to moment, reflects a nervous system with the ability to maneuver between its two branches.That maneuvering is exactly what the accelerator-and-brake model describes: sympathetic (“fight-or-flight”) and parasympathetic (“rest-and-digest”) trading dominance based on what’s actually happening around you. HRV is, in effect, a readout of how smoothly that handoff is working. In this context, more variability, a higher score, is the healthy sign, and a persistently low score is one of the clearest available signals of chronic sympathetic dominance.
Vagal Tone: The Mechanism Behind the Number
Vagal tone is associated and linked to HRV because both are shaped by how actively the Vagus nerve is signaling the parasympathetic branch to stay engaged. Strong vagal tone tends to show up as higher HRV; weak vagal tone tends to show up as a flatter, more rigid heartbeat pattern regardless of what’s actually happening around you.
The Research Behind the Approach
In 2014, a research team at Harvard Medical School used medical-grade HRV monitoring technology to validate and substantiate NuCalm’s ability to reliably and predictably address stress by balancing the autonomic nervous system after each recovery session. The methodology was straightforward: HRV was monitored before and after a Rescue session. This research helped substantiate the claim behind NuCalm’s patent (U.S. Patent 9,079,030), awarded in 2015 for “systems and methods for balancing and maintaining the health of the human autonomic nervous system.” It remains the only patent in the world designed to stop stress in the brain and body reliably and predictably, rather than simply promote relaxation as a subjective state.
What a Rescue Session Actually Moves
The physiological markers the research tracked go beyond a single number. Heart rate itself typically declines, along with the ratio between low-frequency and high-frequency heart rhythm activity, a pattern generally interpreted as reflecting a shift toward greater parasympathetic activity. At the same time, markers like SDNN and RMSSD, two standard clinical measures of beat-to-beat variability, tend to move upward. None of these require a clinical background to interpret in practice: they’re all pointing the same direction, toward a nervous system spending more of its time in recovery mode rather than alert mode.
Reading Your Own Trend Line
Your HRV score will move likely around day to day, because your autonomic nervous system is responding to everything happening in your life, a rough commute, a sick kid, a hard conversation, a genuinely good night’s sleep. A single reading is a snapshot, not a verdict. The number that actually matters isn’t any individual day’s result; it’s whether your baseline, measured across several weeks, is trending upward. That’s the difference between “I had a stressful Tuesday” and “my nervous system is, on the whole, recovering less well than it used to”, and only a trend line can tell you which one you’re looking at.
From Measurement to Action
A number on its own doesn’t fix anything, it just tells you where you stand. If your trend line has been flat or declining for a few weeks, that’s the signal to move from tracking to intervention: How to Regulate Your Nervous System identifies some tools, breathwork, movement, sleep, and technology-assisted approaches, that are designed to actually shift the number, not just describe it.